Health-related quality of life for older patients with chronic low back pain: A structural equation modeling study
Article information

Abstract
Purpose
This study aimed to develop and validate a structural equation model for health-related quality of life in older patients with chronic low back pain.
Methods
We selected social support, symptoms, fear-avoidance beliefs, functional disability, health perception, and health-related quality of life as the main variables based on Wilson and Cleary’s model of health-related quality of life. A total of 211 participants aged ≥65 years who had been diagnosed with low back pain for more than three months were considered in this study. Data were collected from two hospitals in D Metropolitan City and A City, one public health center, and two senior citizen centers. We utilized SPSS/WIN 24.0 and R package ‘plspm’ (R Version 3.1.3) for data analysis.
Results
The overall fit of the proposed hypothesized model was .53, which met the acceptable threshold, confirming the adequacy of the model’s fit. Social support, symptoms, fear-avoidance beliefs, functional disability, and health perception were statistically significant variables in the health-related quality of life, and the explanatory power of these variables was 75.1%. Out of the 15 hypotheses in the model, 13 hypotheses were supported.
Conclusion
The model showed 12 significant direct effects, one significant indirect effect, and 13 significant total effects (both direct and indirect). To enhance the health-related quality of life in older patients with chronic low back pain, alleviating fear-avoidance beliefs and functional disability is necessary and improving positive social resources such as social support and health perception is essential.
INTRODUCTION
The proportion of people aged ≥65 years in South Korea is expected to reach 25.5% by 2030 [1]. Consequently, chronic diseases among older adults are predicted to become increasingly important social issues in the near future. In particular, the prevalence of chronic low back pain among older adults was reported to be 24.1% in 2017 and 10.0% in 2020 [2]. Chronic pain in older adults often persists for a long period, leading to negative psychological states and functional impairments in daily life, ultimately reducing their quality of life and functional abilities [3].
Quality of life is a multidimensional and extensive concept that includes an individual’s subjective evaluation of satisfaction or dissatisfaction with functional abilities in life [4]. The quality of life of patients with chronic pain is influenced by the interaction of physical and psychological symptoms caused by back pain, as well as the social environment [5]. Although various studies have described models of quality of life, the factors that affect quality of life are wide-ranging, and the effects vary depending on the disease [6-8]. Therefore, it is necessary to identify the factors that affect quality of life according to the characteristics of the disease and to understand the relationship between these factors.
The fear-avoidance beliefs arising from physical and psychological symptoms of chronic low back pain significantly influence the deterioration of the quality of life in older patients with chronic low back pain [9]. Fear-avoidance beliefs are disease-specific factors more common in patients with chronic low back pain than in those with other chronic illnesses [9]. These beliefs are based on the internalized notion that physical activity and daily life worsen pain [10]. Furthermore, patients with chronic pain who experience pain as the primary symptom further strengthen these beliefs, avoiding physical activity and worsening their physical functional state, thereby reducing their quality of life [11]. Therefore, to establish a model of quality of life for patients with chronic pain, it is necessary to consider the characteristics of the disease and to verify the relationship between fear-avoidance beliefs and various factors affecting quality of life within the model.
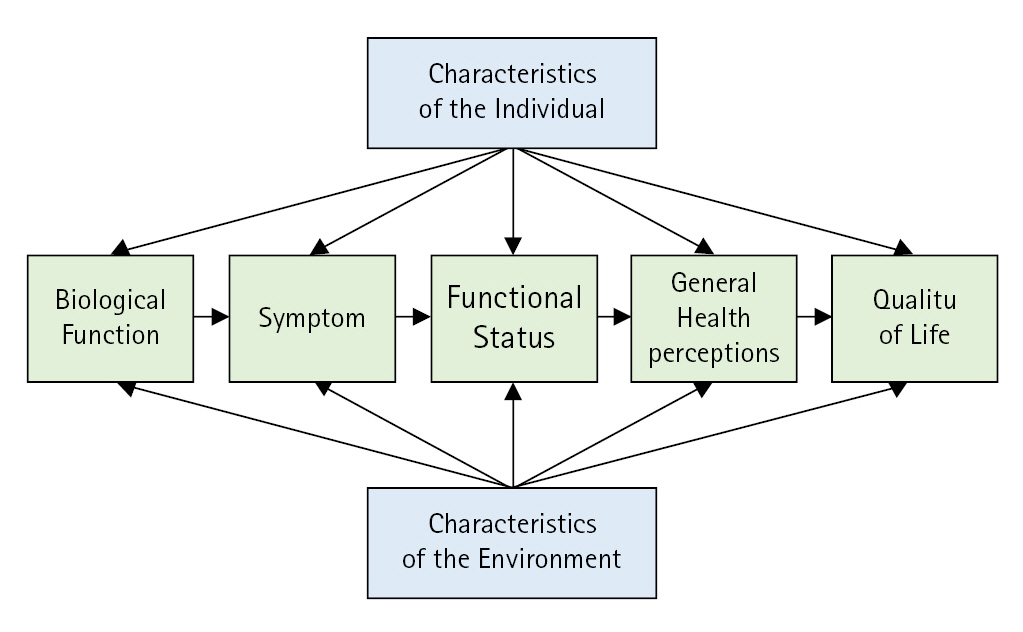
Wilson and Cleary’s health-related quality of life model [12] explains the relationship between various dimensions of health-related quality of life, including physical, psychological, social, and environmental aspects. Wilson and Cleary’s model of health-related quality of life is an essential framework for health assessment, evaluating the overall quality of life (Figure 1). This model is an important measure of health evaluation and evaluates the overall quality of life. It also categorizes physiological factors, symptoms, functional status, health perceptions, and characteristics of quality of life while establishing relationships with the patient’s personal and environmental characteristics. By analyzing the causal relationships between these variables, it measures health-related quality of life. Quality of life studies based on Wilson and Cleary’s model have been widely used, both domestically and internationally, for patients with chronic diseases, patients with cancer, and patients who have undergone surgery [6-8,13,14]. These studies have shown that quality of life varies depending on the characteristics of the disease and the environment, and is influenced by various factors.
In most studies, when targeting individuals with chronic illnesses, the elderly, or patients with back pain, researchers have established the theoretical framework by adding key variables and excluding less relevant ones [6-8]. However, it was challenging to find studies specifically targeting older patients with chronic low back pain. Therefore, it is necessary to examine the relationship between chronic pain in older adults and their quality of life, taking in to account the disease characteristics of chronic pain, based on Wilson and Cleary’s health-related quality of life model. The symptoms described by Wilson and Cleary’s model, such as pain [15] and depression [16], are also present in chronic pain of older adults, which can worsen functional disabilities [15] and reduce quality of life [17]. Social support [6-8] and health perception [18], which are environmental characteristics presented in Wilson and Cleary’s model, have been shown to be related to the quality of life of patients with chronic diseases; however, research on chronic pain of older adults is still insufficient.
Studies targeting older adults with chronic pain [6], and studies focusing on patients with chronic pain [15], have also reported that as pain severity increases, the quality of life decreases. However, research specifically addressing the quality of life of older adults with chronic pain remains limited. Environmental characteristics such as social support can lead to positive health outcomes and improve quality of life, and health perception based on how one perceives their illness is an important factor affecting quality of life. Therefore, to provide reasonable evidence for the causal relationships between quality of life factors and chronic pain in older adults, it is necessary to consider the complex factors of pain, depression, functional disabilities, health perception, and environmental characteristics such as social support, in the quality of life model. Additionally, because fear-avoidance beliefs reflect the characteristics of patients with chronic pain, it is necessary to consider them in the quality of life model.
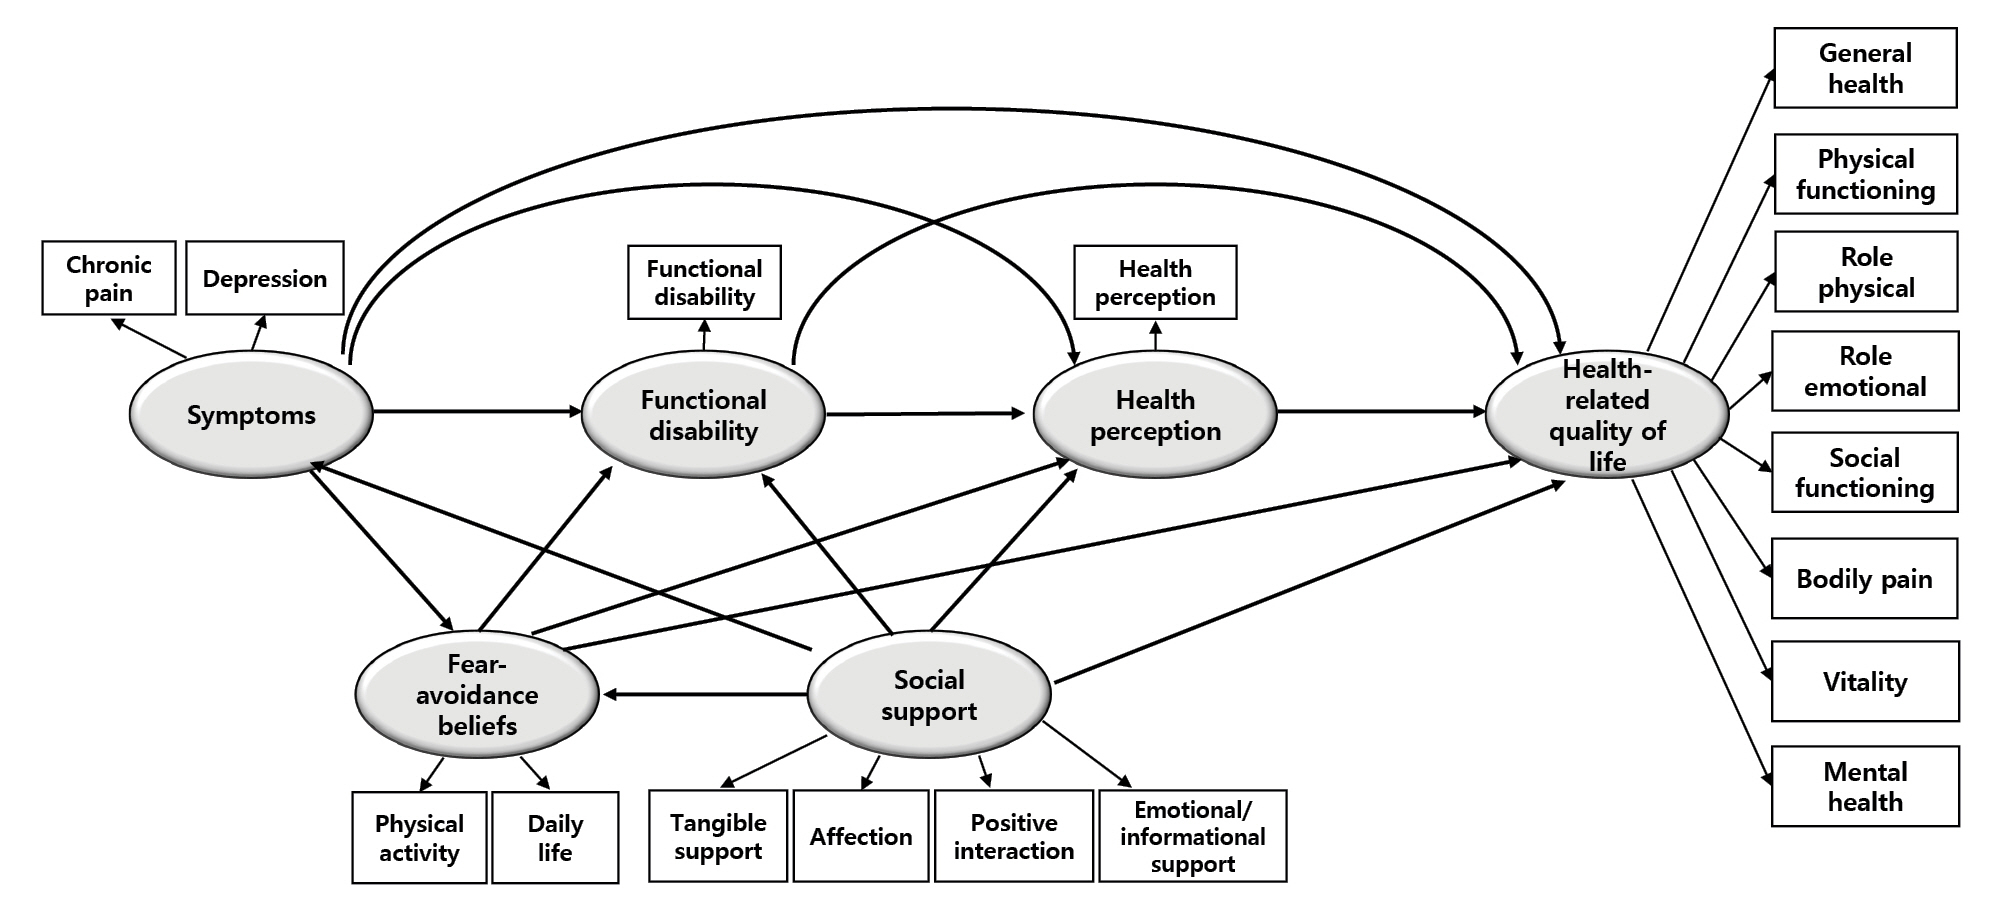
The conceptual model of this study expanded on Wilson and Cleary’s health-related quality of life model by adding fear-avoidance beliefs to the four domains of environmental characteristics, symptoms, functional status, and health perceptions. In total, five domains were examined to identify the factors influencing the quality of life (Figure 2). Therefore, we aim to construct a hypothetical model of health-related quality of life in older patients with chronic low back pain and validate it through research findings. The results of this study will serve as the theoretical groundwork for research on health-related quality of life in older patients with chronic low back pain. They will also be utilized as evidence for proposing nursing interventions that consider both physical and psychological factors among the subjects, as well as for developing programs aimed at improving the quality of life for older patients with chronic low back pain.
METHODS
Ethic statement: This study was approved by the Institutional Review Board (IRB) of Keimyung University (IRB No.: 40525-202002-HR-086-02). Informed consent was obtained from the participants.
1. Study Design
The objective of this research was to create and verify the structural equation model that captures the impact on the health-related quality of life in older patients who are dealing with chronic low back pain.
2. Participants
Older patients with chronic back pain who visited two hospitals in D metropolitan city and A city, one public health center, and two senior citizen centers, who agreed to participate and met the following selection criteria, were included in this study: 1) aged ≥65 years with a diagnosis of low back pain; 2) low back pain symptoms lasting for more than 3 months; 3) capable of understanding the questionnaire with no psychiatric diagnoses.
Prior to conducting the survey, participants were instructed to provide information about their age, the presence or absence of low back pain, and any history of psychiatric diseases in the questionnaire. We collected data from June 15, 2020, to August 30, 2020. The minimum required sample size for conducting a Partial Least Squares (PLS) structural equation modeling analysis is 10 times the number of measurement variables. Since this study included 20 measurement variables, the recommended minimum sample size was 200. Considering the possibility of dropouts, 220 questionnaires were distributed for this study, and we excluded inconsistent response results from the data analysis. Finally, 211 questionnaires were used for the data analysis. The sample size used for analysis was therefore deemed appropriate [19].
3. Measurements
1) Social support
Social support was measured using a tool adapted by Lim [20], which is based on the Social Support Tool developed by Sherbourne and Stewart [21] for chronic diseases. This tool consists of four subdomains: tangible support (four items), affection (three items), positive interaction (three items), and emotional/informational support (eight items). The tool uses a 5-point Likert scale ranging from “not at all” (1 point) to “always” (5 points), with higher scores indicating higher levels of social support. The tool has a high reliability with a Cronbach’s α of .97. In this study, the overall Cronbach’s α was .95, and that for each sub-domain was: .86 for tangible support, .85 for affection, .88 for positive interaction, and .92 for emotional/informational support.
2) Chronic pain
To measure chronic pain, a chronic pain tool developed by Von Korff et al. [22] to measure pain lasting three months or longer, such as low back pain and headaches, was used. We translated this tool into Korean according to the recommendations by Beaton et al. [23]. The tool consists of seven items and three subscales: duration of pain, intensity of pain, and disability caused by pain. Six of the items were scored on a 0~10 scale and the remaining item was scored on a 0~3 scale. In the Disability Score, scores ranging from 0 to 29 points are categorized as 0 points, scores from 30 to 49 points are categorized as 1 point, scores from 50 to 69 points are categorized as 2 points, and scores of 70 points or above are categorized as 3 points. Each score is then recalculated on a 0 to 3 point scale. Higher scores indicated more severe chronic pain. The tool originally had a Cronbach’s α of .74, and Smith et al. [24], using the same tool, reported a Cronbach's α of .91. In this study, the Cronbach’s α was .89.
3) Depression
The Korean version of the depression scale shortened tool, translated by Kee [25] from Sheikh and Yesavage’s [26] depression scale tool, was used to measure the degree of depression in older adults. The tool consists of 15 questions using a binary scale (‘yes’ or ‘no’), with scores ranging from 0 to 15; higher scores indicate more severe depression. The Cronbach’s α reliability coefficient was .95 when the tool was developed, and .87 in this study.
4) Fear-avoidance beliefs
We measured fear-avoidance beliefs using the fear-avoidance belief questionnaire developed by Waddell et al. [27]. Based on the translational guidelines provided by Beaton et al. [23], we have completed the translation of this tool into Korean. This tool is composed of 16 questions and two subscales measuring fear-avoidance beliefs related to physical activity and daily life. Responses were measured on a 7-point Likert scale ranging from 0 (‘completely disagree’) to 6 (‘completely agree’), with higher scores indicating greater fear-avoidance beliefs. When the tool was developed, Cronbach’s α reliability coefficients were .88 for fear-avoidance beliefs related to physical activity and .77 for fear-avoidance beliefs related to daily life. In this study, the overall Cronbach’s α was .78, and the Cronbach’s α coefficients for the subscales of fear-avoidance beliefs related to physical activity and daily life were .76 and .79, respectively.
5) Functional disabilities
To measure functional disability, the tool developed by Fairbank et al. [28] and modified and supplemented by Jeon et al. [29] was used. This tool consists of 10 items: pain intensity, personal hygiene, lifting, walking, sitting, standing, sleeping, sexual activity, social activity, and travel. In this study, sexual activity was excluded to account for participants without spouses, and the measurement tool consisted of nine items. Higher scores indicate more severe functional disabilities. Cronbach’s α reliability coefficient was .85 when the tool was developed, .93 in Jeon et al.’s study [29], and .89 in this study.
6) Health perception
Health perception was measured using a tool developed by Ware [30], which was translated by Yoo et al. [31] and modified for use with older patients by Lee and Chung [32]. The tool consists of 20 questions in six subscales: current health, prior health, health outlook, health worry and concern, resistance-susceptibility, and rejection of sick role. Responses were measured on a 4-point Likert scale ranging from 1 (‘completely disagree’) to 4 (‘completely agree’), with scores ranging from 20 to 80. Higher scores indicated greater health perception. The Cronbach’s α reliability coefficient was .91 when the tool was developed, and .62 in Yoo et al.’s [31] study, .85 in Lee and Chung’s study [32], and .86 in this study.
7) Health-related quality of life
Health-related quality of life was measured using The Medical Outcomes Study 36-Item Short Form Health Survey Instrument Version II developed by Ware et al. [33]. The tool consists of 36 items, including one item measuring changes in health status and 35 items measuring health-related quality of life, with eight subscales: physical functioning (10 items), role physical (four items), bodily pain (two items), general health (five items), vitality (four items), social functioning (two items), role emotional (three items), and mental health (five items). Scores were calculated by assigning weights to each response and summing them to obtain a total score, which was then converted to a 0~100 scale, excluding one item that measured changes in health status. Higher scores indicated a higher health-related quality of life. When the tool was developed, the Cronbach’s α reliability coefficients for the eight subscales were .78 to .93. In this study, the overall Cronbach’s α was .86, and the Cronbach’s α coefficients for the subscales of physical functioning, role physical, bodily pain, general health, vitality, social functioning, role emotion, and mental health were .85, .86, .80, .82, .75, .76, .81, and .77, respectively.
4. Data Analysis
The measured data were analyzed using SPSS/WIN 24.0 (IBM Corp.) and the R package ‘plspm’ (R Version 3.1.3). Descriptive statistics, including frequencies, percentages, means, and standard deviations, were used to analyze the general characteristics of the participants and each variable. The differences in health-related quality of life for the general characteristics were analyzed using t-tests and ANOVA. Data analysis using PLS structural equation modeling was divided into two stages: measurement model analysis and structural model analysis. The reliability of the measurement indicators was assessed using Cronbach’s α, which measures internal consistency and composite reliability.
The goodness-of-fit of the hypothesized model was verified with the following indices: Cronbach’s α ranged from .70 to .95, composite reliability ranged from .82 to .97, factor loading ranged from .65 to .96, average variance extracted index ranged from .51 to .87, Fornell-Larcker criterion, model’s coefficient of determination (R2) ranged from .24 to .75, redundancy values ranged from .03 to .37, and the overall model fit was .53, which met the acceptable threshold, confirming the adequacy of the model’s fit.
5. Ethical Considerations
After obtaining approval from the IRB at Keimyung University (IRB No.: 40525-202002-HR-086-02), data collection for this study began. Data collection involved obtaining consent from the responsible departments of hospitals, public health centers, and senior centers. After obtaining consent, voluntary participation of the subjects was initiated, and they provided written consent for the study. The survey took approximately 20 minutes to complete, and all participants in the study were provided with appropriate tokens of appreciation.
RESULTS
1. General and Disease Characteristics of the Participants
Of the 211 participants included in this study, 63.0% were female and 37.0% were male. The mean age was 72.2±5.97 years, with 70.1% and 26.5% of participants in the age range of 65~74 and 75~84 years, respectively. In terms of marital status, 59.2% were married and 29.9% were widowed; 50.7% lived with their spouses and 28.9% lived alone. Regarding the education level, the proportion was highest for individuals who were high school graduates (31.3%) and those who had less than elementary school education (25.1%). Regarding religion, 39.8% of the participants had no religion and 37.4% were Buddhists. In terms of economic status, 64.5% of the participants were in the middle economic class. Differences in health-related quality of life were found to be related to marital status (F=6.36, p=.002), living arrangements (F=8.72, p<.001), educational level (F=7.75, p<.001), and economic status (F=7.49, p<.001). Post hoc analysis showed that health-related quality of life was higher among unmarried and married individuals than among widowed individuals. Participants living with a spouse or children/others had a higher health-related quality of life than those living alone. At the education level, the groups with high school and college or higher education showed higher health-related quality of life than the elementary or middle school groups. Participants in the middle or high economic classes had a higher health-related quality of life than those in the low economic class (Table 1).

Demographic Characteristics and Statistical Analysis of Health-Related Quality of Life (N=211)
In terms of disease characteristics, 31.3% of the participants had an illness duration of >10 years. Furthermore, regarding the frequency of low back pain, 38.9% felt it occasionally and 22.3% experienced low back pain 3~4 times per week. Regarding the pattern of low back pain, 36.0% of the participants experienced severe pain with movement and 15.6% reported that the pain worsened at night. The causes of back pain were aging (39.8%) and occupational factors (22.3%). The types of treatment included medication (49.3%) and physical therapy (26.1%). Of the respondents, 63.5% reported experiencing treatment effects and 27.5% reported worsening back pain when bending forward. Of the patients, 77.7% had other chronic diseases and 78.2% had no history of surgery for low back pain. Significant differences were observed in health-related quality of life depending on the duration of symptoms (F=7.81, p<.001), frequency of low back pain (F=8.59, p<.001), low back pain patterns (F=5.51, p<.001), therapeutic effect (t=2.83, p<.001), presence of other chronic conditions (t=10.98, p<.001), and surgical history (t=6.95, p=.009). Post-hoc analysis showed that health-related quality of life was higher in groups with symptom duration of <1 year, 1~3 years, 3~5 years, and 5~10 years, than in the group with symptom duration of >10 years. Health-related quality of life was higher in the groups experiencing low back pain 1~2 times per week or occasionally than in the group experiencing it daily (Table 2).

Health-Related Quality of Life by Disease Characteristics (N=211)
2. Fit Analysis of the Structural Model
In the structural model analysis, fit analysis involves evaluating the coefficient of determination R2, the redundancy values in the structural model, and the overall model fit. The coefficient of determination R2 assesses the explanatory power of the latent variables, and higher values indicate greater explanatory power. Redundancy values are statistical estimators in the structural equation modeling, and positive values indicate a good fit of the structural model. Lastly, the overall model fit should be at least .10 or higher, with values between .25 and .36 considered as moderate fit and values between .10 and .25 as weak fit.
In this study, the fit analysis of the structural model revealed positive redundancy values for all latent variables. Additionally, the coefficient of determination R2 showed explanatory power for symptoms (.24), fear-avoidance beliefs (.20), health perception (.44), and functional disability (.64), while the dependent variable, health-related quality of life, had an R2 of .75, indicating a high explanatory power. The overall model fit was .53, validating the appropriateness of the proposed structural model in this study.
3. Descriptive Statistics of Variables
In this study, there were significant negative correlations between health-related quality of life and symptoms, fear-avoidance beliefs, and functional disability. Additionally, health-related quality of life showed positive correlations with social support (r=.37, p<.001) and health perception (r=.59, p<.001), indicating consistent and expected directional relationships among the factors based on prior research, thus ensuring the construct validity (Table 3). The results of this study regarding the direct, indirect, and total effects of the different variables, as well as their statistical significance, are shown in Table 4 (Figure 3). β represents the standardized regression coefficient, which was used to calculate the effects and verify the statistical significance between exogenous and endogenous variables. In the path model, direct effects refer to the direct impact of independent variables on dependent variables, whereas indirect effects refer to the influence of independent variables on dependent variables through one or more mediating variables. The total effect represents the sum of the direct and indirect effects. When interpreting the study results, it is important to consider not only direct effects, but also indirect and total effects, as it is difficult to accurately determine the effect size based on direct effects alone. We used the bootstrap method to investigate the direct, indirect, and total effects of the measured and endogenous variables. In this study, bootstrapping was performed 500 times.
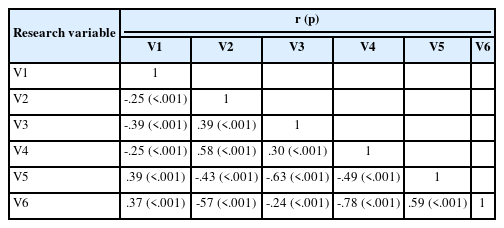
Correlations Between Research Variables (N=211)

Direct, Indirect, and Total Effect Analysis of Hypothetical Models (N=211)

Path diagram of the hypothetical model.
When symptoms were selected as endogenous variables, social support showed significant direct (β=-.49, p<.001) and total effects (β=-.49, p<.001) on symptoms, and accounted for 23.6% of the variance. When fear-avoidance beliefs were used as endogenous variables, social support showed no significant direct (β=.21, p=.125), indirect (β=-.25, p=.290), or total effects (β=-.04, p=.371) on catastrophic beliefs. However, symptoms had significant direct (β=.51, p<.001) and total effects (β=.51, p<.001) on fear-avoidance beliefs. The explanatory power of these variables for catastrophic beliefs was 20.0%. When functional disability was considered as the endogenous variable, social support showed significant direct (β=-.28, p<.001), indirect (β=-.19, p<.001), and total effects (β=-.47, p<.001) on functional disability. Symptoms had also significant direct (β=.36, p<.001), indirect (β=.23, p<.001), and total effects (β=.58, p<.001) on functional disability. Fear-avoidance beliefs had significant direct (β=.45, p<.001) and total effects (β=.45, p<.001) on functional disability. Social support, symptoms, and fear-avoidance beliefs accounted for 64.4% of functional disabilities.
When health perception was used as an endogenous variable, social support showed statistically significant direct (β=.22, p<.001), indirect (β=.22, p<.001), and total effects (β=.43, p<.001) on health perception; likewise, symptoms also showed statistically significant direct (β=-.38, p<.001), indirect (β=-.14, p<.001), and total effects (β=-.52, p<.001). Fear-avoidance beliefs showed statistically significant direct (β=-.21, p<.001), indirect (β=-.03, p<.001), and total effects (β=-.24, p<.001) on health perception, while functional disability showed statistically significant direct (β=-.06, p=.473) and total effects (β=-.06, p=.473). Social support, symptoms, and fear-avoidance beliefs accounted for 43.9% of functional disabilities.
Among the factors affecting health-related quality of life, the indirect (β=.37, p<.001) and total effects (β=.47, p<.001) of social support were statistically significant; however, the direct effect (β=.09, p=.075) was not. Symptoms had statistically significant direct (β=-.32, p<.001), indirect (β=-.37, p<.001), and total effects (β=-.69, p<.001) on health-related quality of life; similarly, fear-avoidance beliefs also had statistically significant direct (β=-.23, p<.001), indirect (β=-.17, p<.001), and total effects (β=-.39, p<.001). Functional disability had statistically significant direct (β=-.28, p<.001), indirect (β=-.01, p<.001), and total effects (β=-.29, p<.001) on health-related quality of life, while health perception had statistically significant direct (β=.18, p<.001) and total effects (β=.18, p<.001). The explanatory power of these variables on health-related quality of life, as the final endogenous variable, was 75.1%.
DISCUSSION
This study aimed to construct a structural model of health-related quality of life for elderly individuals with chronic pain. Based on disease-related characteristics and key concepts of health-related quality of life, the study proposed the causal relationships and directions between social support, symptoms, fear-avoidance beliefs, functional disability, health perceptions, and health-related quality of life. This study analyzed the structural model of health-related quality of life in older patients with chronic low back pain using PLS structural equation modeling. PLS structural equation modeling provides a robust statistical validation for the relationship between the research model and the population, especially when dealing with numerous variables and complex path explanations of diverse variables.
In the proposed model of health-related quality of life in older patients with chronic low back pain, social support as an environmental characteristic exerts an indirect influence on health-related quality of life. Furthermore, symptoms, fear-avoidance beliefs, functional disability, and health perceptions were found to have a direct impact on health-related quality of life in the proposed model, explaining 75.1% of the variance. The explanatory power of health-related quality of life in hospitalized patients with pulmonary tuberculosis was 52.4% [13]. For the study focusing on older patients with degenerative arthritis, which falls under chronic musculoskeletal pain, the explanatory power was 63.6% [6].
The reason for the higher explanatory power of the model in this study compared to previous research is that most of the prior studies presented the main variables from the health-related quality of life model as they were. However, in this study, fear-avoidance beliefs a disease-related characteristic of chronic pain patients, were selected as a major variable. By adding this significant variable that influences the quality of life in older patients with chronic low back pain, it is estimated that the explanatory power of this study’s model was higher. According to the findings of this study, Wilson and Cleary’s model of health-related quality of life, social support indirectly influences health-related quality of life, while symptoms, fear-avoidance beliefs, functional disability, and health perceptions directly impact health-related quality of life. These results align with the theoretical pathways of the key concepts in Wilson and Cleary’s model. Thus, this study has been validated as an appropriate model with sufficient variables to predict health-related quality of life in older patients with chronic low back pain.
In this study, the health-related quality of life of older patients with chronic low back pain was found to be 41.37 out of 100, which is similar to the results of a study by Lee [15], who used the same tool and reported a score of 42.84. In contrast, a study by Im [34] on community-dwelling older individuals without chronic pain reported a higher level of quality of life, with a score of 63.13, which indicated that the presence of chronic pain has a significant impact on quality of life. Older individuals experiencing chronic pain have various problems compared to general older individuals, and are more vulnerable to physical and psychological issues related to pain that affect their quality of life [16].
Social support for older people with chronic back pain was found to have a positive (+) indirect effect on their health-related quality of life. In addition, social support had a negative (-) direct effect on symptoms and functional disability, and a positive (+) direct effect on health perception. Our study found that social support, an environmental characteristic, affects symptoms such as pain, physical function, and depression [6,35]. This is consistent with the results of previous studies [13,18] which reported that social support indirectly affects health-related quality of life. Additionally, social support has been demonstrated to have a direct negative (-) effect on functional disability, which is consistent with previous reports showing that social support indirectly affects functional status in older patients with degenerative joint disease [6]. Moreover, Halvorsrud et al. [7] reported that social support had an effect on symptoms and functional disability, and that the higher the health perception, the higher the quality of life. Therefore, social support for older adults with chronic low back pain is necessary at multiple environmental levels, including family, medical professionals, and the community, as it can help reduce negative physical and psychological symptoms and ultimately contribute to improving their quality of life.
Symptoms were found to have a positive (+) direct effect on fear-avoidance beliefs and functional disability, and a negative (-) direct effect on health perception and health-related quality of life in older adults with chronic low back pain. In other words, as the degree of symptom experience increases, fear-avoidance beliefs and functional disabilities tend to increase, and individuals tend to perceive their health and quality of life negatively. These results are consistent with those of previous studies [15,16,36], which confirmed that the greater the experience of symptoms in older individuals with chronic low back pain, the lower their quality of life. Additionally, as this study measured the latent variables of symptoms such as physical pain and psychological symptoms such as depression, it is consistent with previous research [6,13,37], which confirmed that not only physical but also psychological symptoms such as depression are major factors affecting quality of life in older adults with chronic low back pain.
In the current study, symptoms were found to affect fear-avoidance beliefs, which are often higher in individuals with chronic low back pain than in those with other chronic conditions owing to their physical and psychological symptoms [9]. These results are consistent with the findings of Seo’s study [17]. Specifically, symptoms associated with chronic low back pain were found to affect functional disability, which is similar to previous studies reporting that pain intensity and damage from chronic low back pain are related to functional disability [38]. In addition, the symptoms of this population were found to affect their health perception, which is supported by the results of Park et al. [39], who reported a negative correlation between pain intensity and health perception in patients with chronic low back pain. Therefore, older individuals with chronic low back pain, who experience pain as a primary disorder, may avoid physical and daily life activities due to fear-avoidance beliefs, leading to functional disability. Thus, active management of physical and psychological symptoms is important for improving the quality of life of these individuals.
The fear-avoidance beliefs of older adults with chronic low back pain were found to have a positive (+) direct effect on functional disability and a negative (-) direct effect on health perception and health-related quality of life in this study. Fear-avoidance belief refers to the inherent belief that daily life and physical activity exacerbate pain [10]. This negative psychological factor leads to a fear of further injury and ultimately makes movement difficult, leading to persistent functional disability in patients with chronic low back pain, as reported in previous studies [10,40]. Notably, Trinderup et al. [41] showed that fear-avoidance beliefs affect disability levels and quality of life in patients with chronic low back pain. Similarly, Seo [17] showed that fear-avoidance beliefs are a major factor in functional disability and health-related quality of life in patients with chronic low back pain, and Won [38] found that higher fear-avoidance beliefs were associated with higher levels of pain and functional disability, which is similar to the results of this study.
Our study showed that functional disability in older adults with chronic low back pain was found to have a negative (-) direct effect on health-related quality of life. Functional disability in older adults with chronic low back pain was found to be correlated with quality of life, and the more severe the limitations in daily functional activities caused by chronic low back pain, the lower the quality of life [15,16]. Seo [17] reported that functional disability in patients with chronic low back pain is a major factor affecting health-related quality of life, which is similar to the results of this study. In addition, patients with rheumatoid arthritis who have better functional status have a higher quality of life [42], and postoperative physical function and activity restriction have been reported as the most important predictors of improved health-related quality of life in patients who have undergone total hip arthroplasty [18].
Health perception of older adults with chronic low back pain had a direct positive (+) effect on their health-related quality of life. Previous studies on health perception and quality of life have found that an individual’s subjective perception of their health has a greater effect on their quality of life than an objective evaluation of their health status [43]. Moreover, individuals with higher subjective health levels tend to have a better quality of life [44], and health perception of older adults with chronic musculoskeletal pain has been shown to have an effect on their quality of life [45]. Furthermore, Choi and Park [46] reported a significant difference in quality of life based on the subjective perception of chronic pain among older individuals. Therefore, our results, together with those of previous studies, confirm that environmental characteristics such as social support and symptoms, fear-avoidance beliefs, functional disability, and health perception have direct or indirect effects on the health-related quality of life of older individuals with chronic low back pain.
CONCLUSION
In this study, statistically significant variables affecting the health-related quality of life in older patients with chronic low back pain included social support, symptoms, fear-avoidance beliefs, functional disability, and health perceptions. Among these, symptoms were presented as the variable with the greatest explanatory power. Specifically, these factors could serve as foundational data for developing comprehensive interventions aimed at mitigating fear-avoidance beliefs and functional disability caused by symptoms, while also enhancing social support and health perception levels. Such interventions, addressing both physical and psychological symptoms, could ultimately be employed to enhance the health-related quality of life of older patients with chronic low back pain. In addition, this study has a limitation in that it does not include older patients with chronic back pain who were hospitalized due to the severity of their pain or those who have impaired mobility in their own homes. It is suggested that future research should encompass the entire population of older patients with chronic back pain and explore other variables beyond the ones that were investigated in this study.
Notes
Authors' contribution
Study conception and design acquisition - SL and EJL; Data collection - SL; Analysis and interpretation of the data - SL and EJL; Drafting and critical revision of the manuscript - SL and EJL
Conflict of interest
No existing or potential conflict of interest relevant to this article was reported.
Funding
None.
Data availability
Please contact the corresponding author for data availability.
Acknowledgements
This article is adapted from Suin Lee’s doctoral dissertation in 2021.